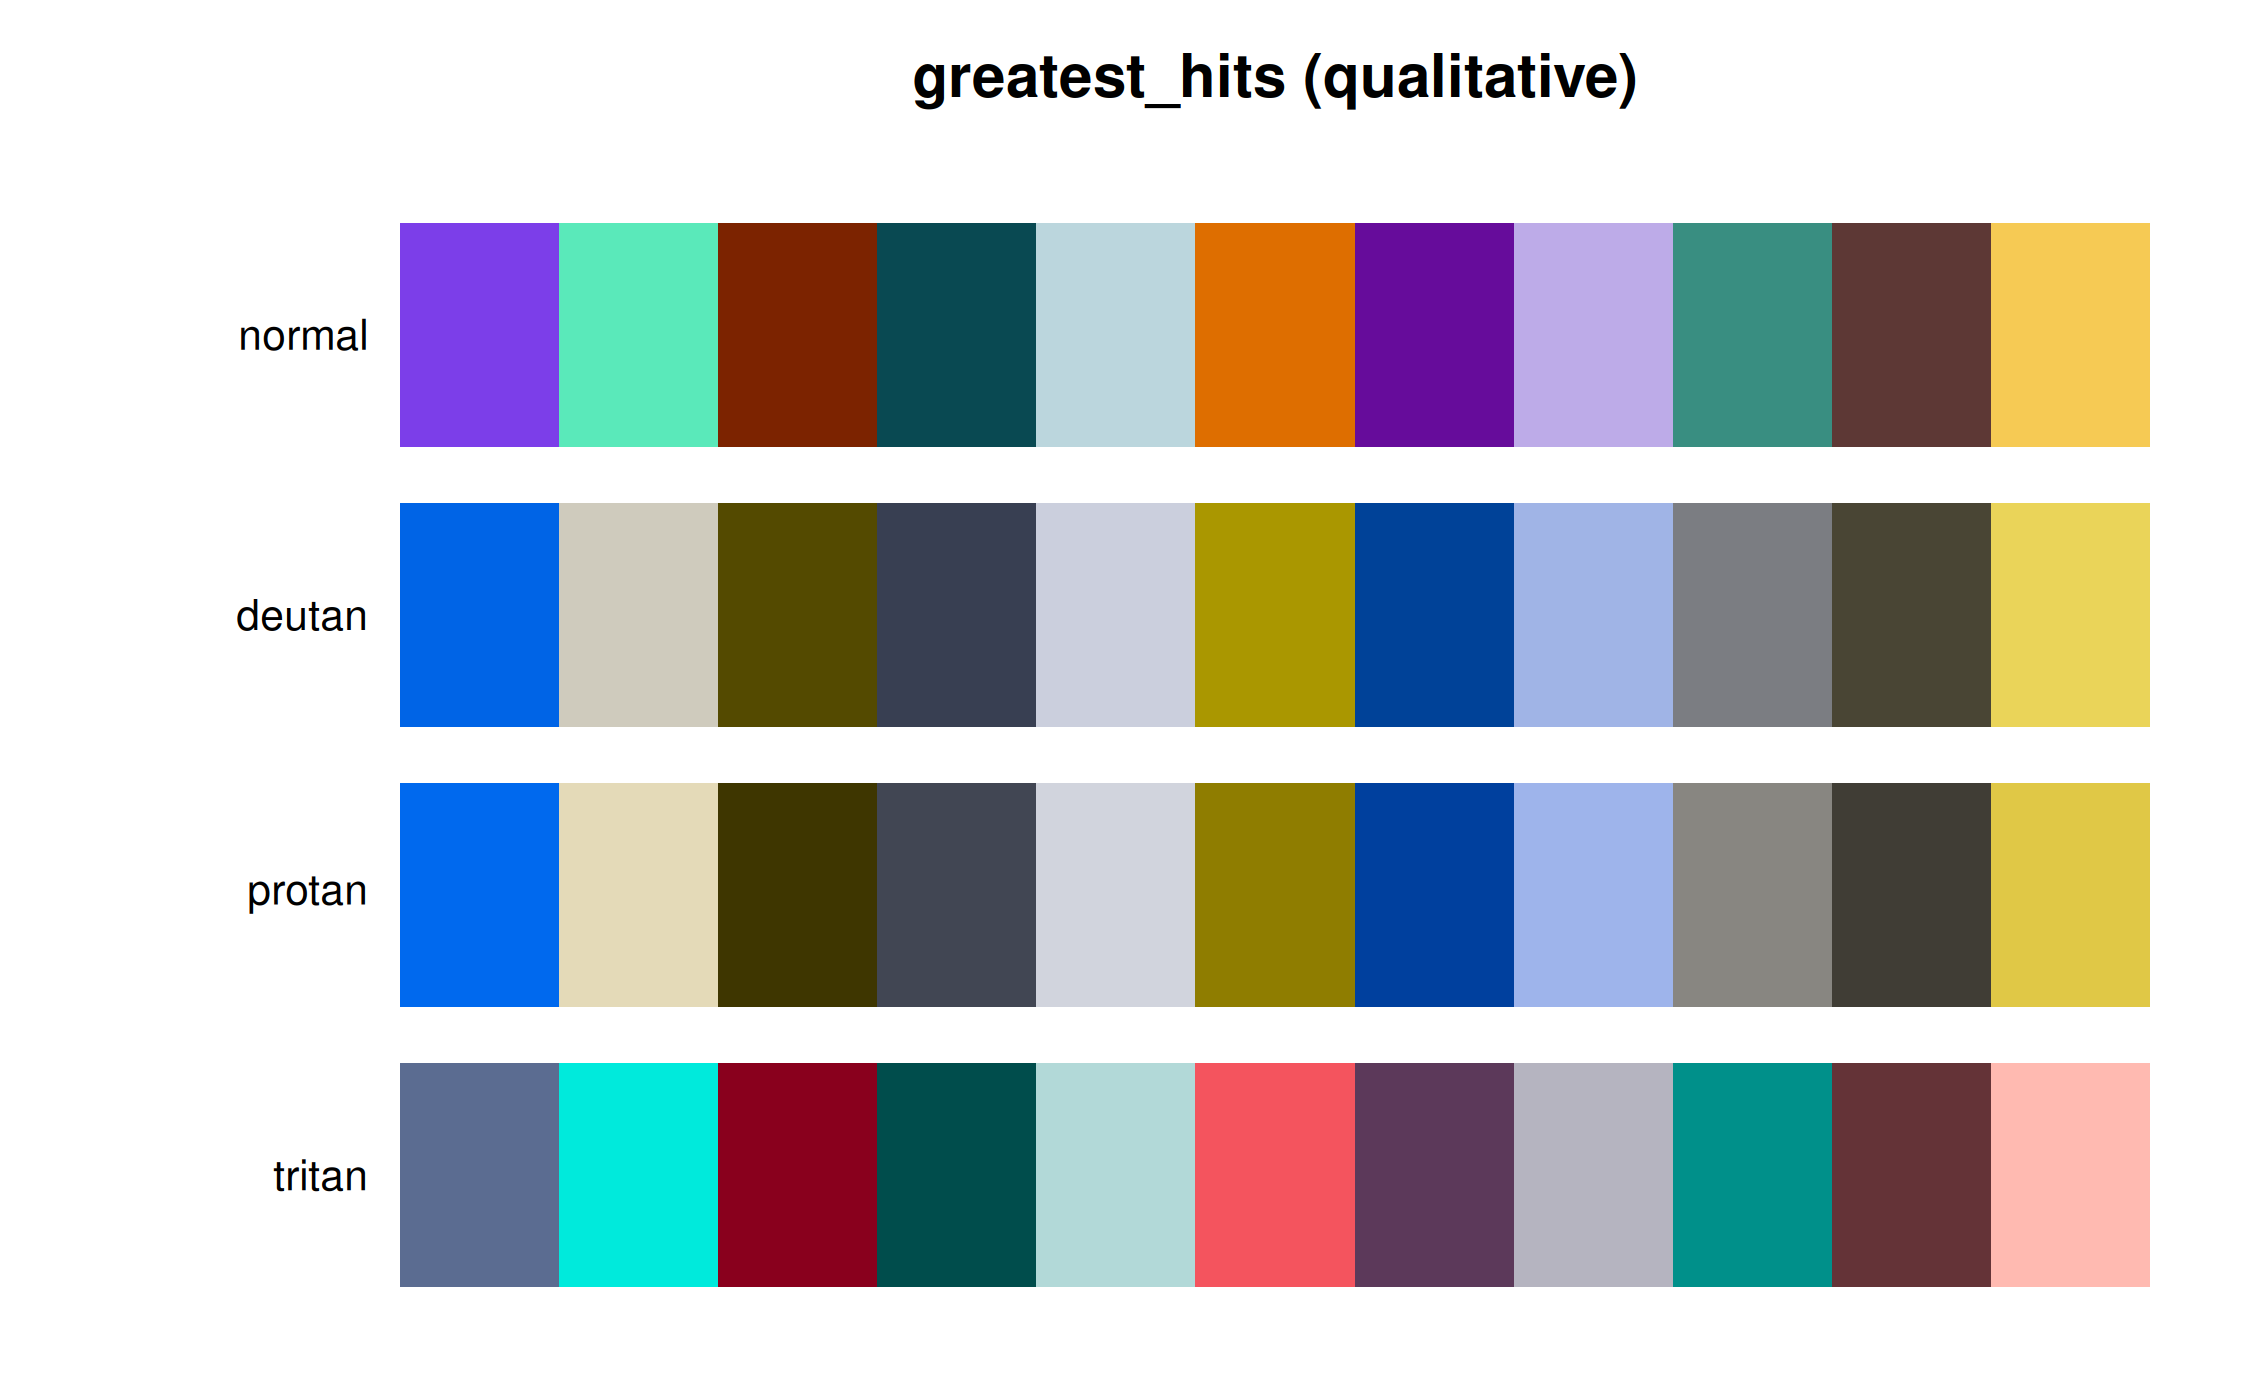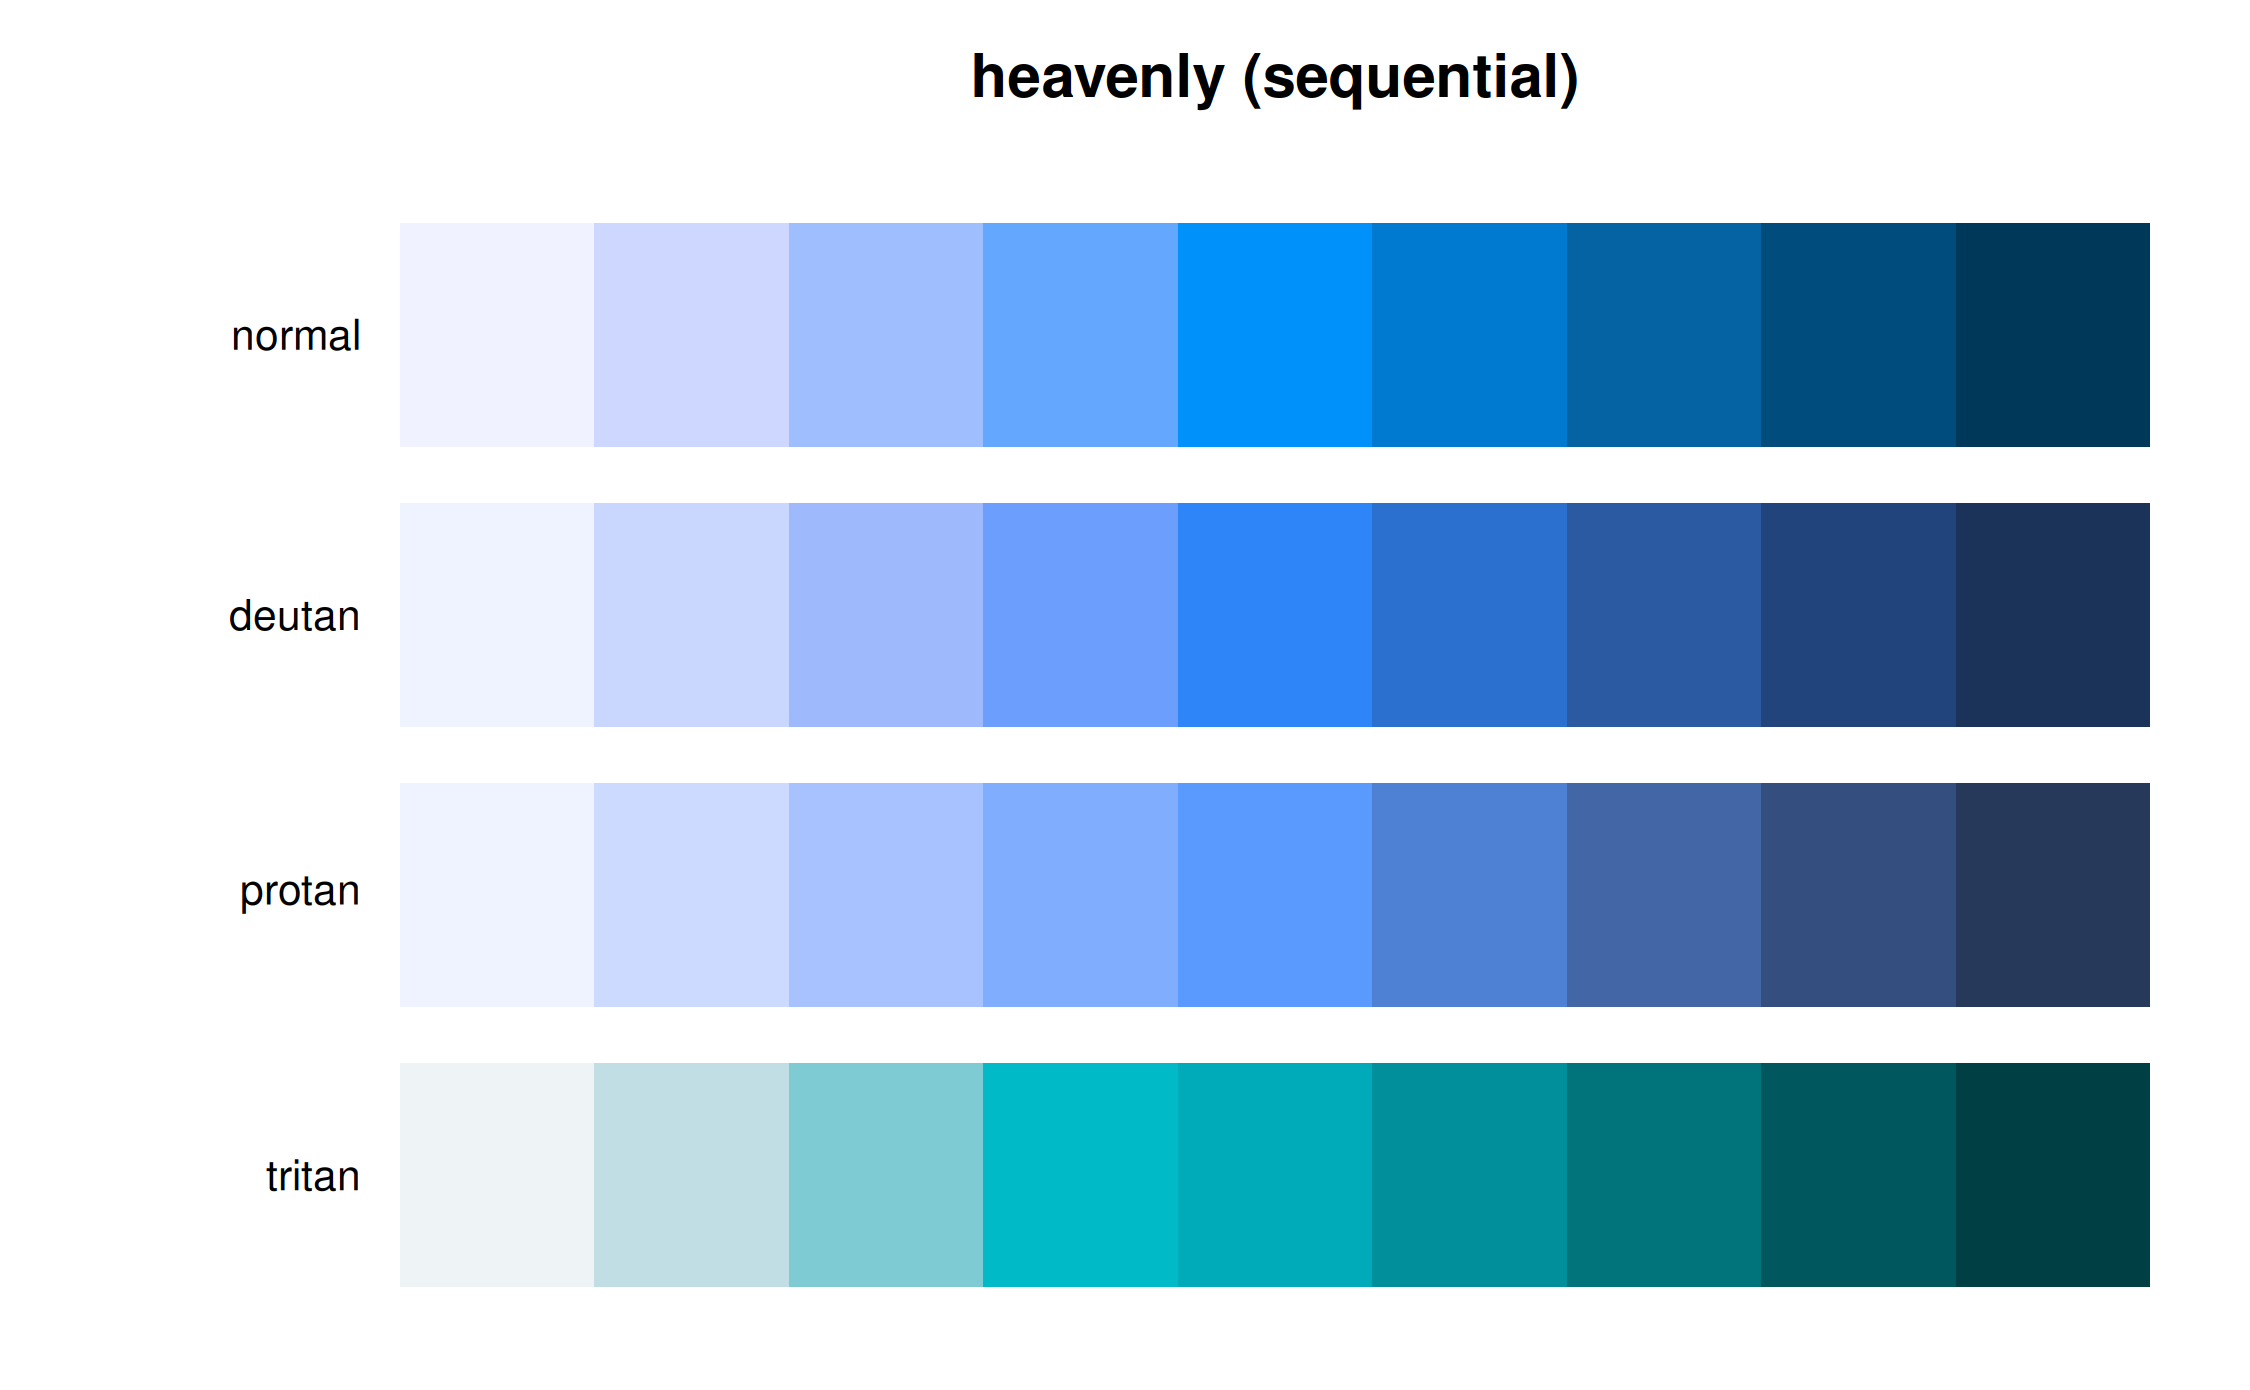
Draws one row of swatches per vision type, so a palette can be eyeballed the way its readers will actually see it.
Usage
killer_cvd_grid(
  palette = "greatest_hits",
  n = NULL,
  type = c("qualitative", "sequential", "diverging"),
  direction = 1,
  severity = 1
)
Arguments
- palette
Palette name, e.g.
"flash"or"opera_night". Seekiller_names().- n
Number of colours to return. Defaults to every colour the palette defines. For
type = "qualitative"this cannot exceed the number of colours available, because inventing extra categorical colours would silently break the palette's colourblind-safe separation.- type
Palette type:
"qualitative"for unordered categories,"sequential"for ordered low-to-high values,"diverging"for values spread either side of a meaningful midpoint.- direction
1for the palette's natural order,-1to reverse it.- severity
Severity of the simulated deficiency, from 0 to 1.